
For water service providers
Water Utilities Management
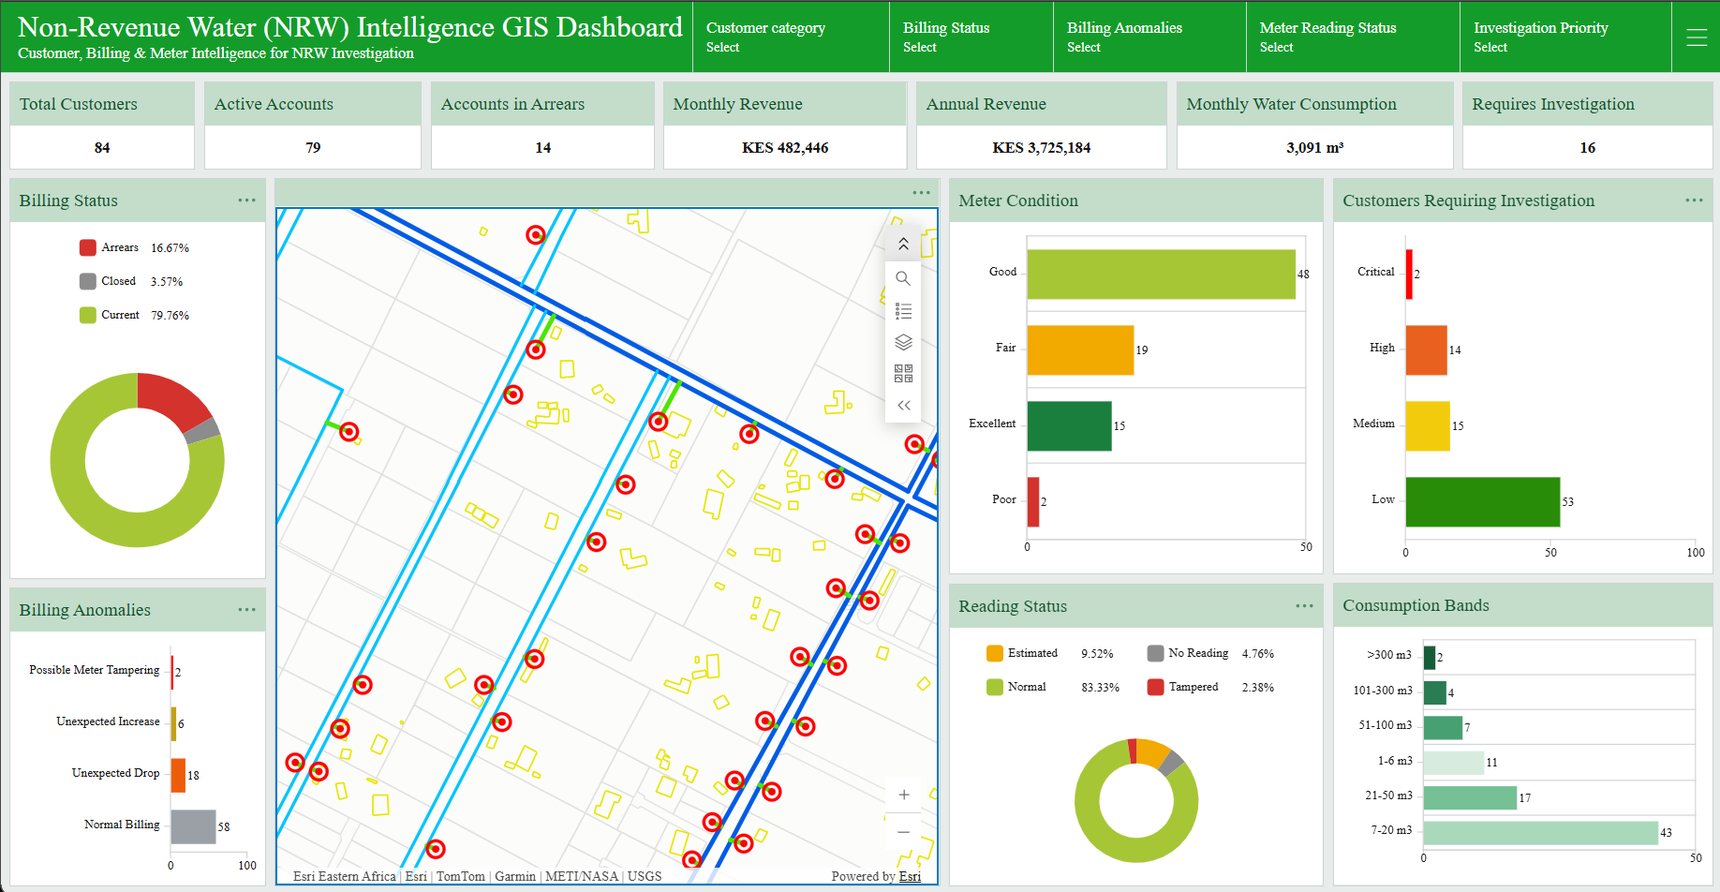
A decision platform that puts your customer, billing and meter data on the ground, with commercial overview, asset management and NRW intelligence in one place.
- Reads
- Customer, billing and meter data
- Joins it to
- Mains, valves and parcels
- Dashboards
- Commercial · Assets · NRW
- Figures shown
- Kilifi pilot
What it solves
Six problems that follow from customer, billing and network data held in separate systems.
High non-revenue water, no way to localise it
Losses are known in aggregate at the end of the month, not by zone, main or account while there is still time to act.
Fragmented operational information
Billing sits in one system, the network in a drawing, meter history in a spreadsheet. Nothing reconciles.
Reactive maintenance
Crews are dispatched when a pipe bursts, not when condition data says it is about to.
Limited visibility of assets
Valves, mains and service lines exist in institutional memory rather than in a register anyone can query.
Difficult inspection prioritisation
Every account looks equally suspicious, so field officers are allocated by intuition and geography.
Expansion planning on thin information
Network extensions are budgeted without knowing where the town has actually grown since it was last mapped.
How it connects
From ERP records to one connected spatial intelligence platform, integrating commercial, network, and geospatial data into actionable dashboards for smarter water utility decisions.
Where to extend next
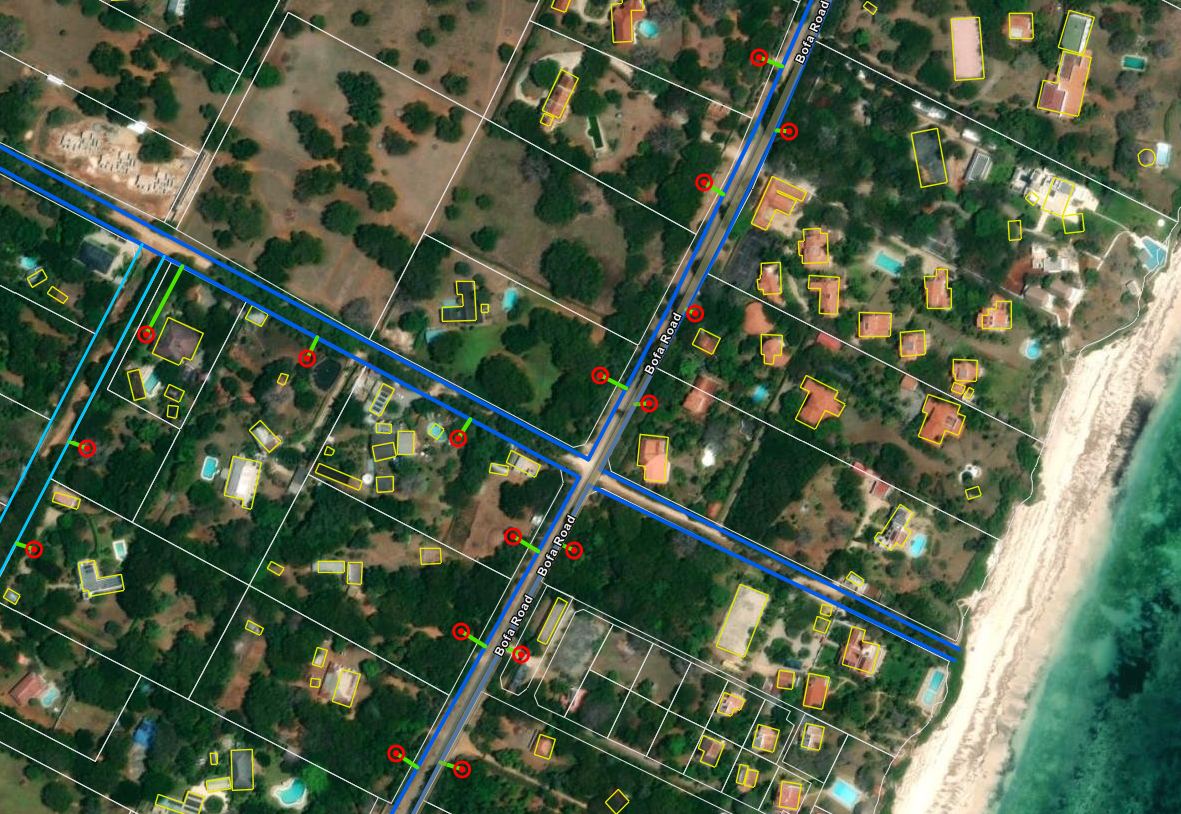
Satellite imagery and building-footprint analysis identify where development has actually happened since the area was last mapped: new structures inside the service area, and new structures beyond the end of the main. Each becomes a costed candidate for extension rather than a guess in a budget line.
- Newly developed areas identified from imagery, not from reports
- Future customer growth estimated from building counts
- Network extensions planned along real demand corridors
- Budget estimates tied to metres of main and connection counts
- Capital investment prioritised by yield per shilling
Why it matters
Six outcomes, from commercial performance to customer service.
Improved commercial performance
Revenue, arrears and consumption read together, by zone and by customer class.
Better asset visibility
A queryable register of every main, valve, service line and meter with its condition.
Smarter investigations
Field officers dispatched against a ranked list with a documented reason per account.
Evidence-based planning
Extension and capital budgets built on observed development, not on projections.
Faster operational decisions
Management sees near real-time performance instead of waiting for month-end.
Improved customer service
Queries answered against the connection, its meter history and its service line.
Next step
See where your water goes.
020 765 0202 · +254 794 338133 · info@geosurveysandgeospatialinfo.co.ke