Geosurveys & Geospatial Information Limited — for your surveying & mapping solutions
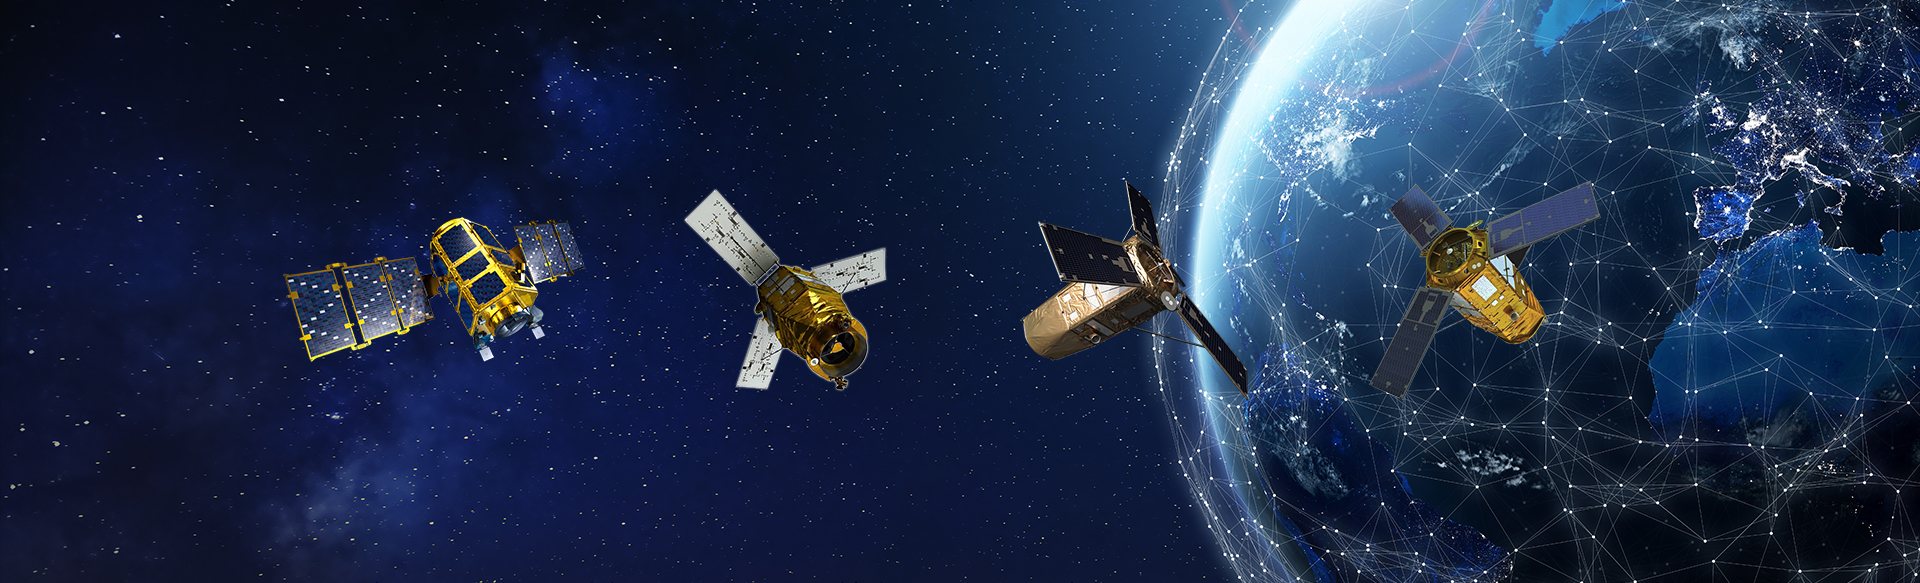
An illustration of four satellites in a row against black space, with the curve of the Earth at the right

Satellite Imagery.

With SI Imaging Services

We have partnered with SI Imaging Services, a world-leading Earth observation provider, to deliver access to the KOMPSAT and SpaceEye-T satellites. Designed for precision, agility and insight, the imagery lets you map cities, monitor crop health, track threats and manage crises, for faster responses and smarter planning.

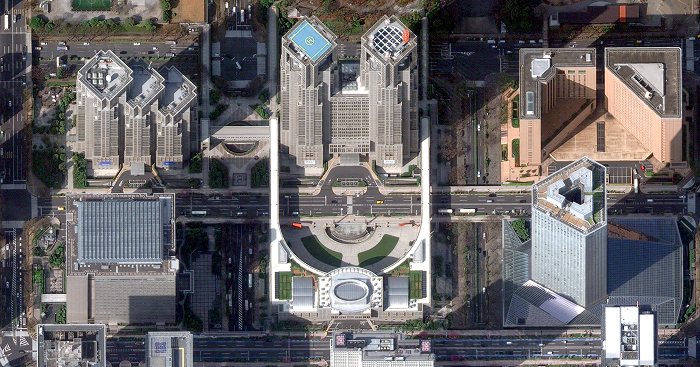
Satellite imagery looking straight down on a city centre: tower blocks with rooftop plant, a formal plaza between them and streets lined with trees
Sample · KOMPSAT © KARI, distributed by SIIS

01 · The satellites

Down to 25 cm, and radar that sees through cloud.

Every satellite, with its full specifications and imaging modes.

Optical · Ultra-high resolution

SpaceEye-T
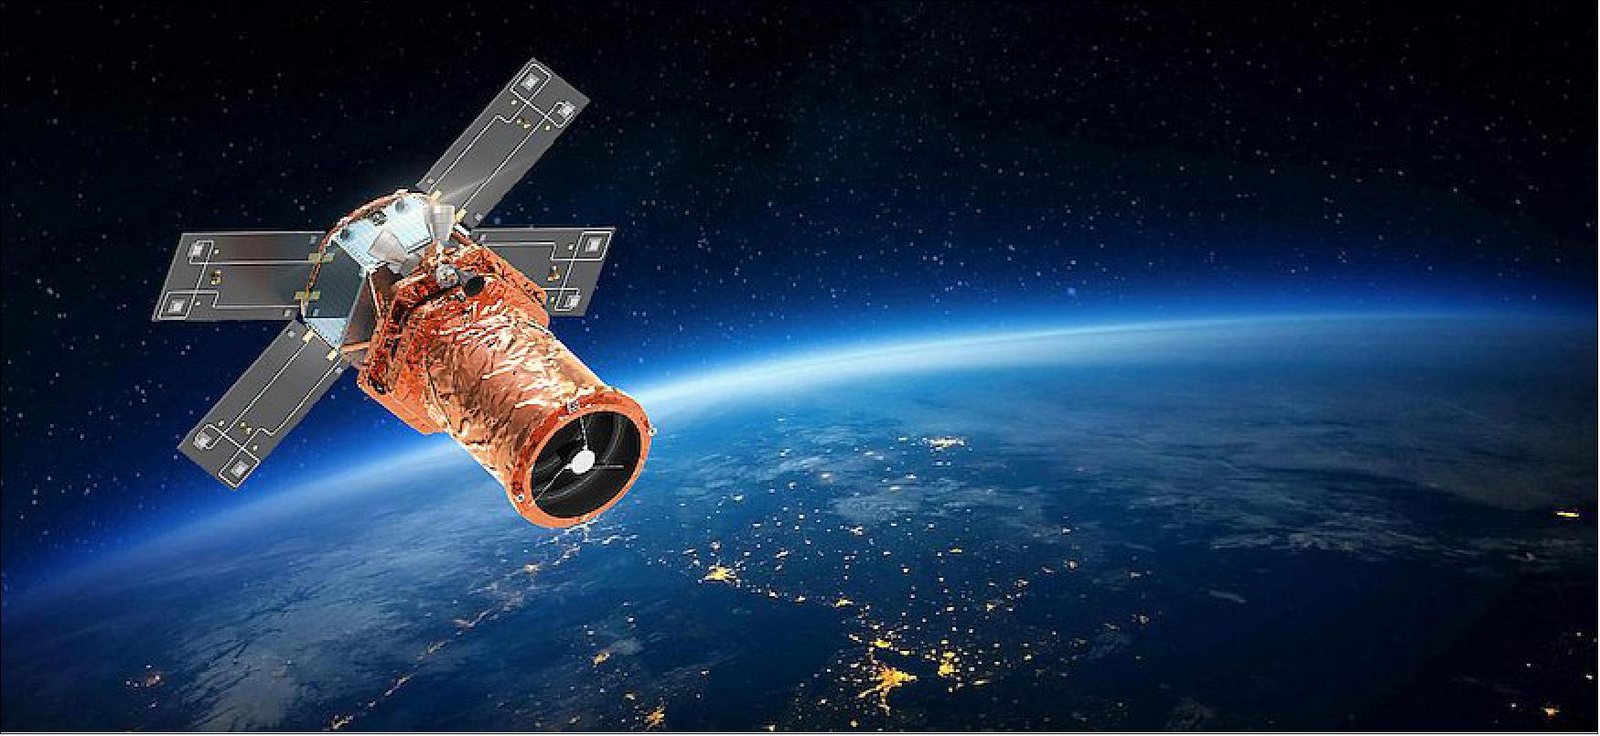
An illustration of the SpaceEye-T satellite, a copper-wrapped body with four grey solar panels, over the Earth at night with city lights below
Resolution
PAN 25 cm · MS 1 m
Bands
Panchromatic and 4 multispectral
Swath width
12 km
Revisit
Under 1 day, global daily revisit
Launched
March 2025

Optical · Very high resolution

KOMPSAT-3A

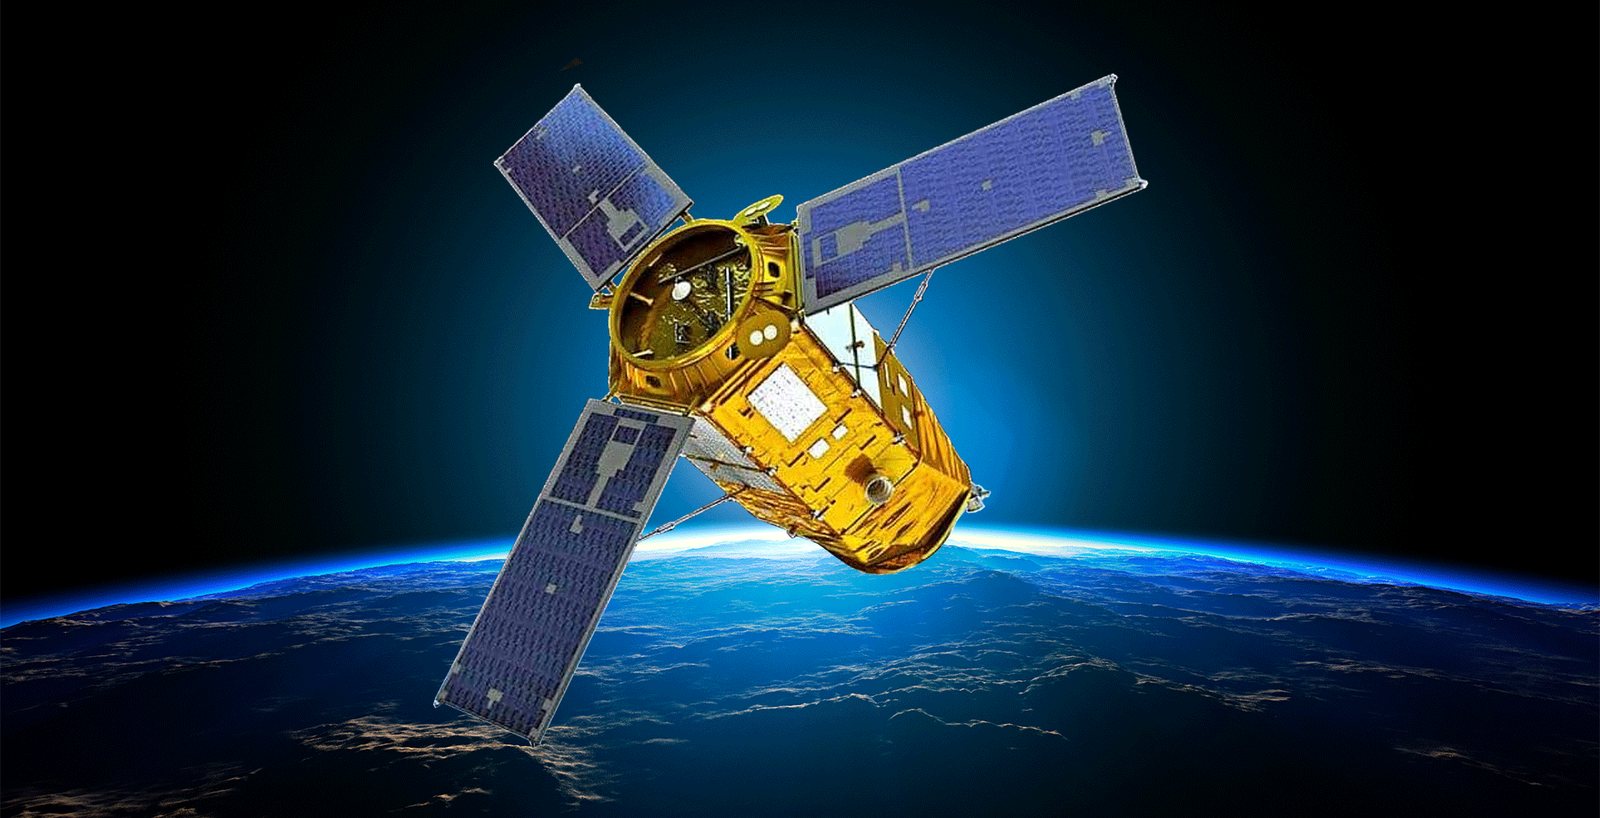
An illustration of the KOMPSAT-3A satellite, a gold body with three blue solar panels, above the glowing horizon of the Earth
Resolution
PAN 0.4 m · MS 1.6 m, at nadir
Swath width
13 km at nadir
Spectral bands
PAN 450–900 nm · Blue 450–520 nm · Green 520–600 nm · Red 630–690 nm · NIR 760–900 nm
Location accuracy
6.2 m RMSE, under 9.4 m CE90, with POD/PAD
Revisit
1 day
Bit depth
14 bits per pixel
Products
Level 1R, Level 1G, ortho-ready
Projection / datum
UTM / WGS84
File format
GeoTIFF
Launched
March 2015
Imaging modes
ModeSwathCoverage
Strip13 kmUp to 4,000 km long
Multi-point13 km per target—
Wide area25 kmAdjacent strips combined, up to 204 km long
Stereo13 kmSingle- or multi-pass

Optical · Very high resolution

KOMPSAT-3

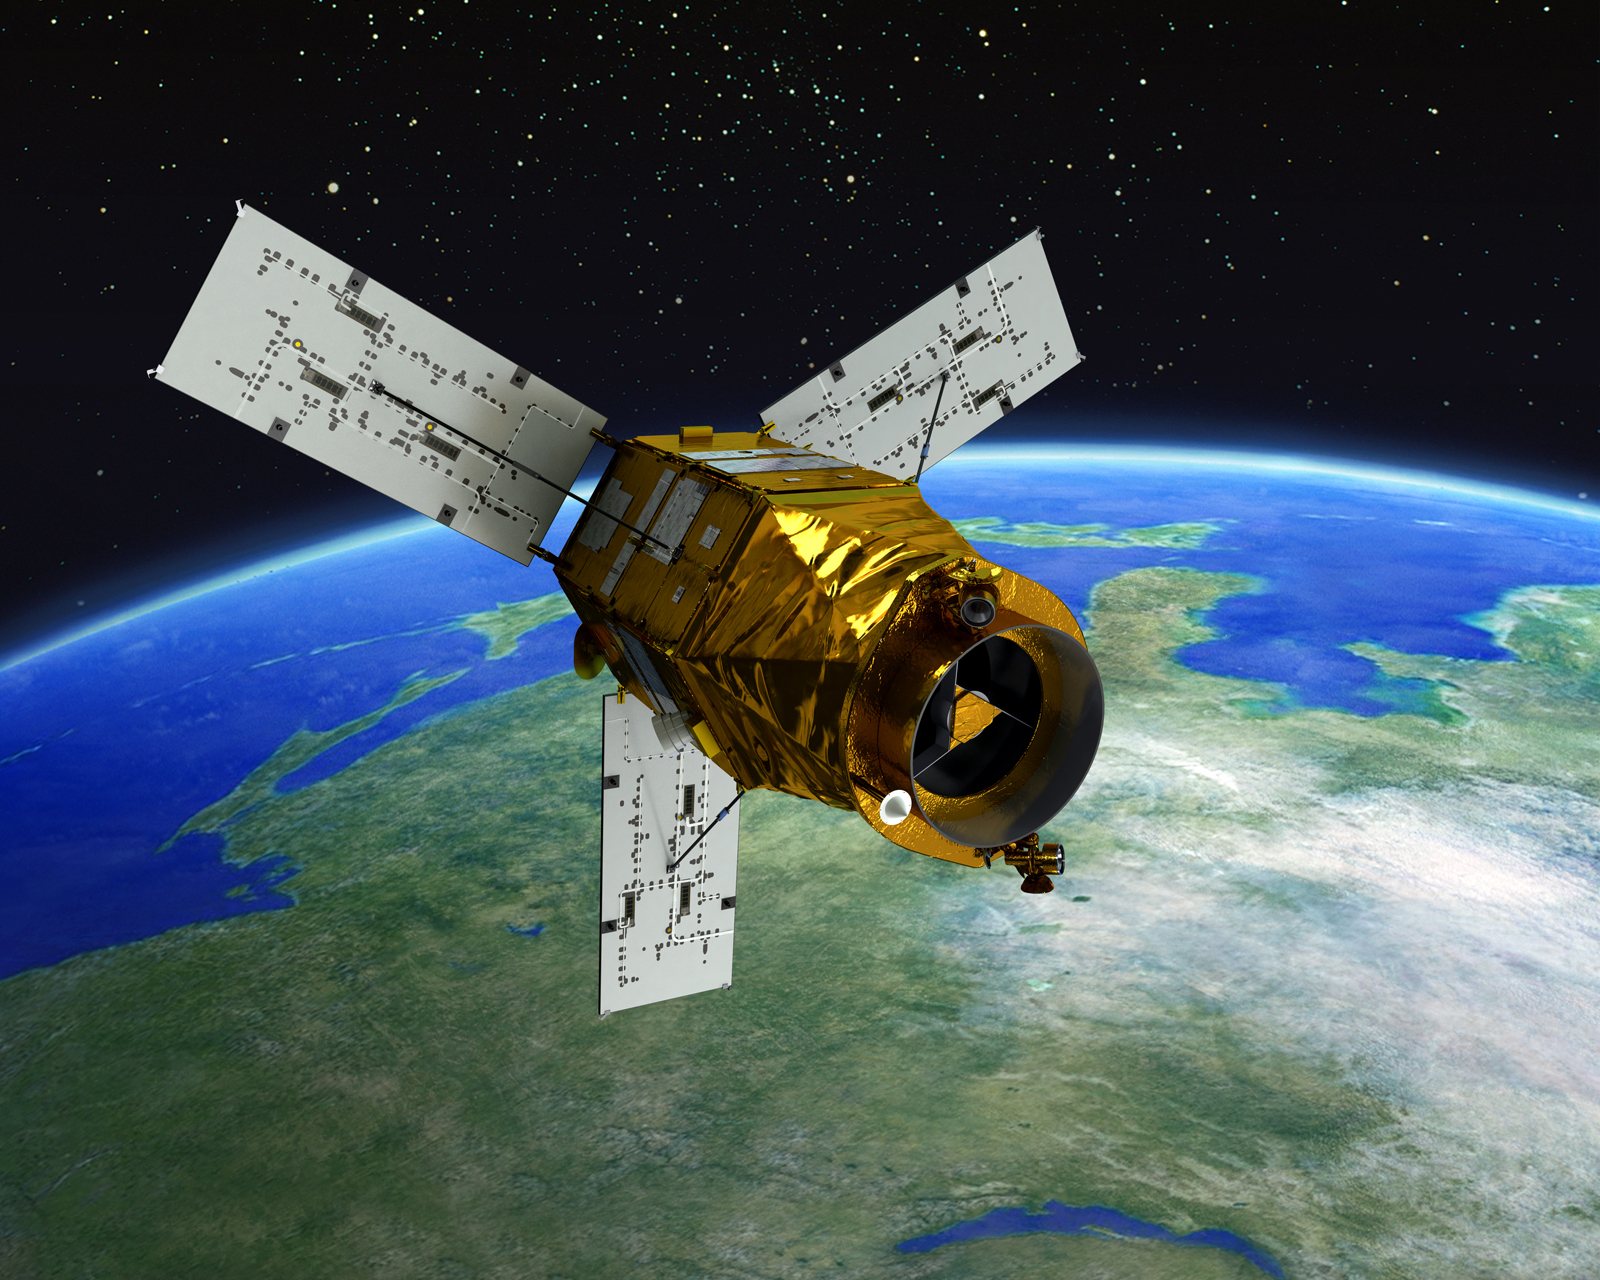
An illustration of the KOMPSAT-3 satellite, a gold body with white solar panels, over green land and cloud
Resolution
PAN 0.5 m · MS 2 m
Swath width
16 km at nadir
Spectral bands
PAN 450–900 nm · Blue 450–520 nm · Green 520–600 nm · Red 630–690 nm · NIR 760–900 nm
Location accuracy
19.9 m RMSE, under 30.19 m CE90, with POD/PAD
Revisit
1 day
Bit depth
14 bits per pixel
Products
Level 1R, Level 1G, ortho-ready
Projection / datum
UTM / WGS84
File format
GeoTIFF
Launched
May 2012
Imaging modes
ModeSwathCoverage
Strip16 kmUp to 4,000 km long
Multi-point16 km per target—
Wide area45 kmAdjacent strips stitched, up to 100 km long
Stereo16 kmSingle- or multi-pass, for elevation models

Optical · High resolution · Archive only
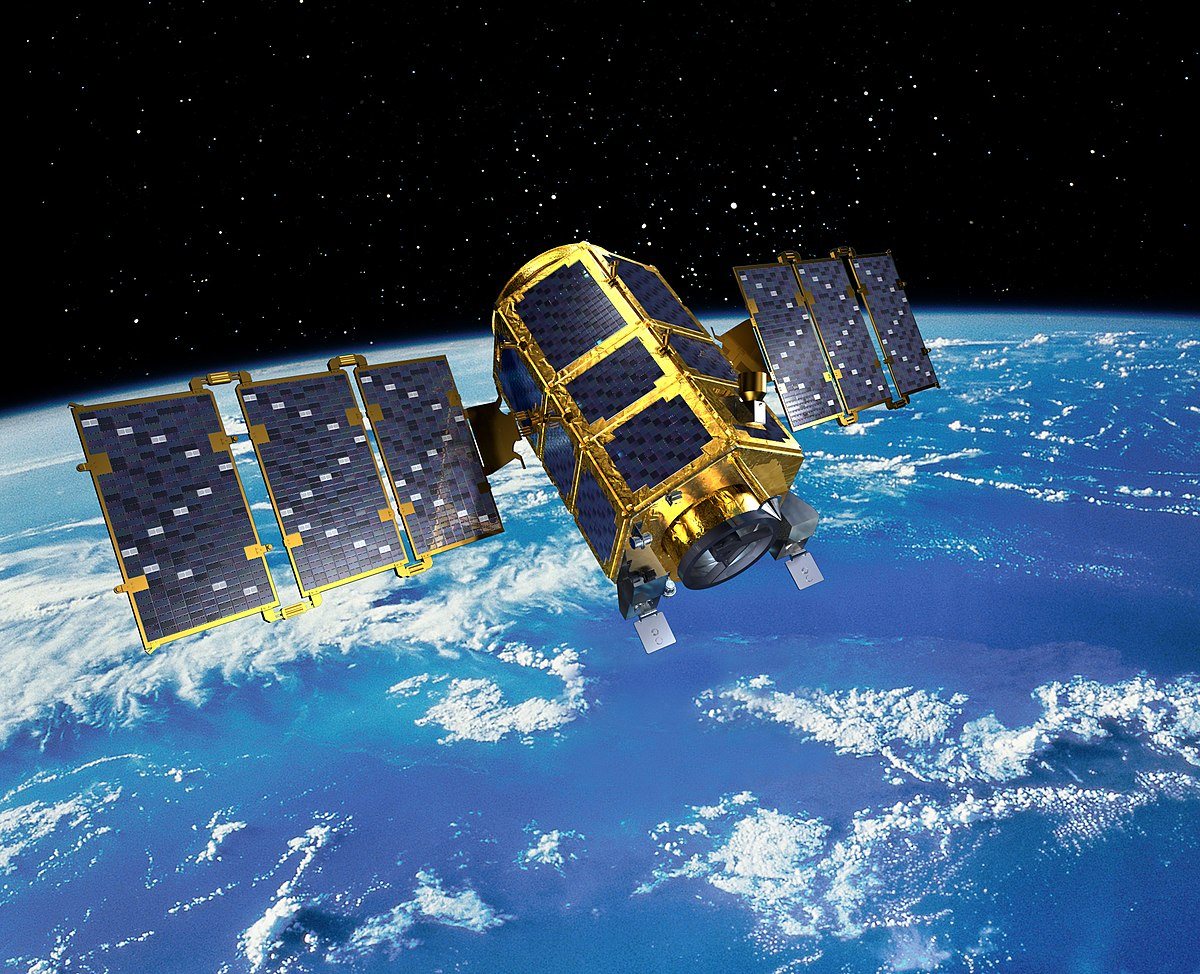
KOMPSAT-2

An illustration of the KOMPSAT-2 satellite, a gold body with blue solar panels, over ocean and cloud
Availability
Archive imagery only
Resolution
PAN 1 m · MS 4 m
Swath width
15 km at nadir
Spectral bands
PAN and MS (blue, green, red, NIR)
Bit depth
10 bits per pixel
Products
Level 1R, ortho-ready (Level 1G)
Launched
July 2006
Imaging modes
ModeSwathCoverage
Strip15 kmLong strips

Radar · Very high resolution

KOMPSAT-5

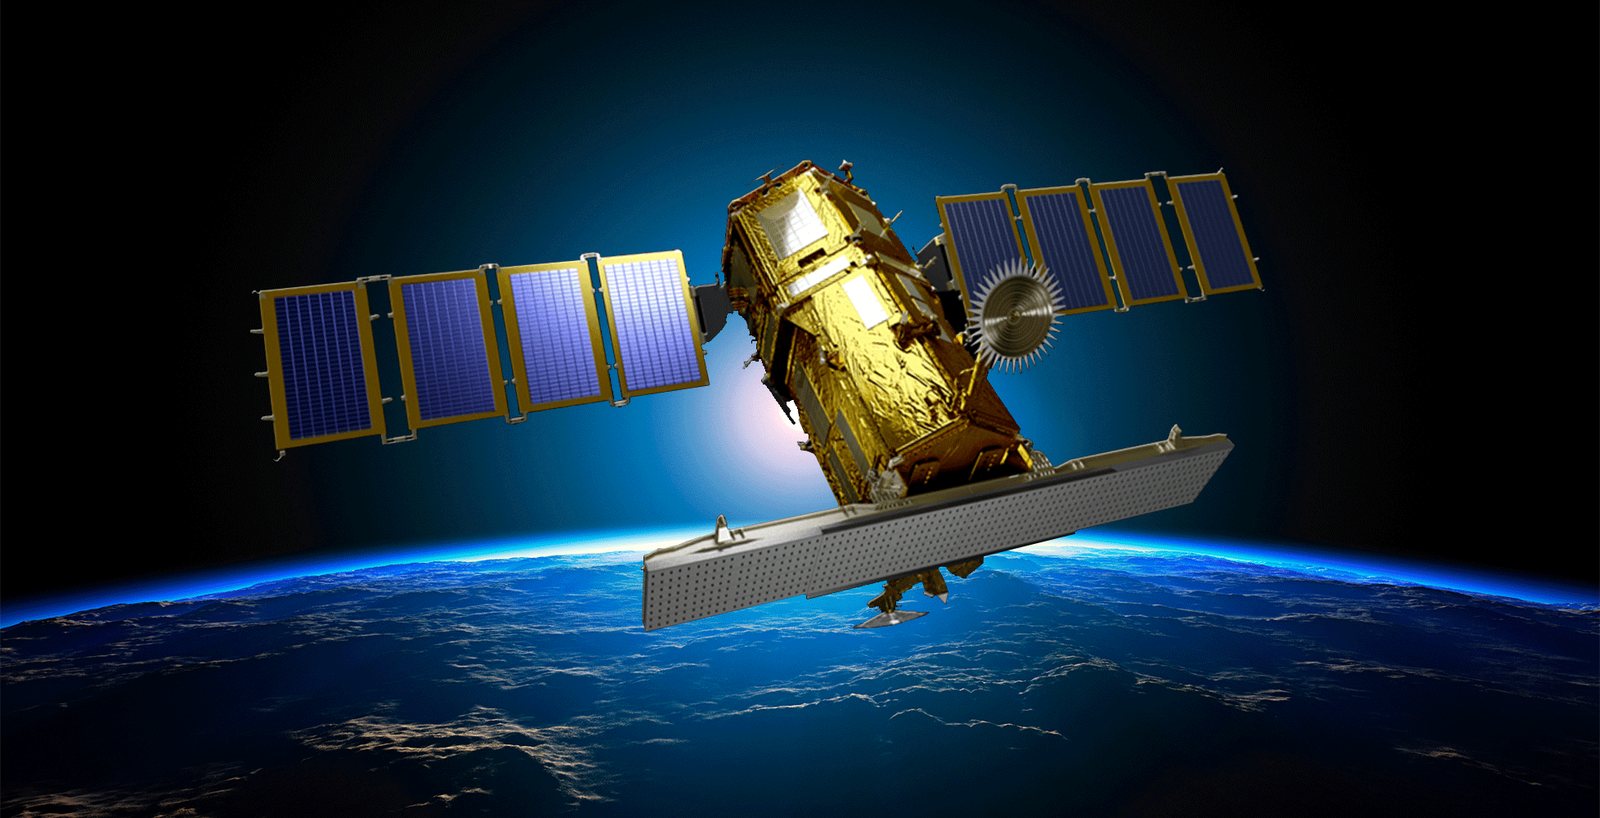
An illustration of the KOMPSAT-5 radar satellite, a gold body with blue solar panels and a long flat antenna, above the Earth's horizon
Sensor
X-band SAR, day or night, through cloud
Resolution
0.85 m to 20 m, by mode
Swath width
5 km to 100 km, by mode
Revisit
0.5–1 day, in any weather
Location accuracy
6.22 m CE90
Processing levels
Level 1A (SLC), Level 1C, Level 1D
InSAR
Yes: repeat passes combined to measure ground movement
Projection / datum
UTM / WGS84
File format
HDF5, GeoTIFF
Launched
August 2013
Imaging modes
ModeDetailSwathCoverage
Spotlight, ultra high (UH)0.85 m5 km—
Spotlight, enhanced high (EH)1 m5 km—
Spotlight, high (HR)1 m5 km—
Strip, enhanced (ES)2.5 m30 kmUp to 840 km long
Strip, standard (ST)3 m30 kmUp to 840 km long
Wide swath, enhanced (EW)20 m100 kmUp to 840 km long
Wide swath (WS)20 m100 kmUp to 840 km long

Not sure which satellite?

Tell us the area and the detail you need, and we will recommend one.

Order imagery

KOMPSAT-7, an optical satellite, has now launched: ask us for its specifications and availability. KOMPSAT-6 (radar) and KOMPSAT-7A (optical) are still to come. What the terms mean

02 · Applications

What it is used for.

01

Mapping and planning.

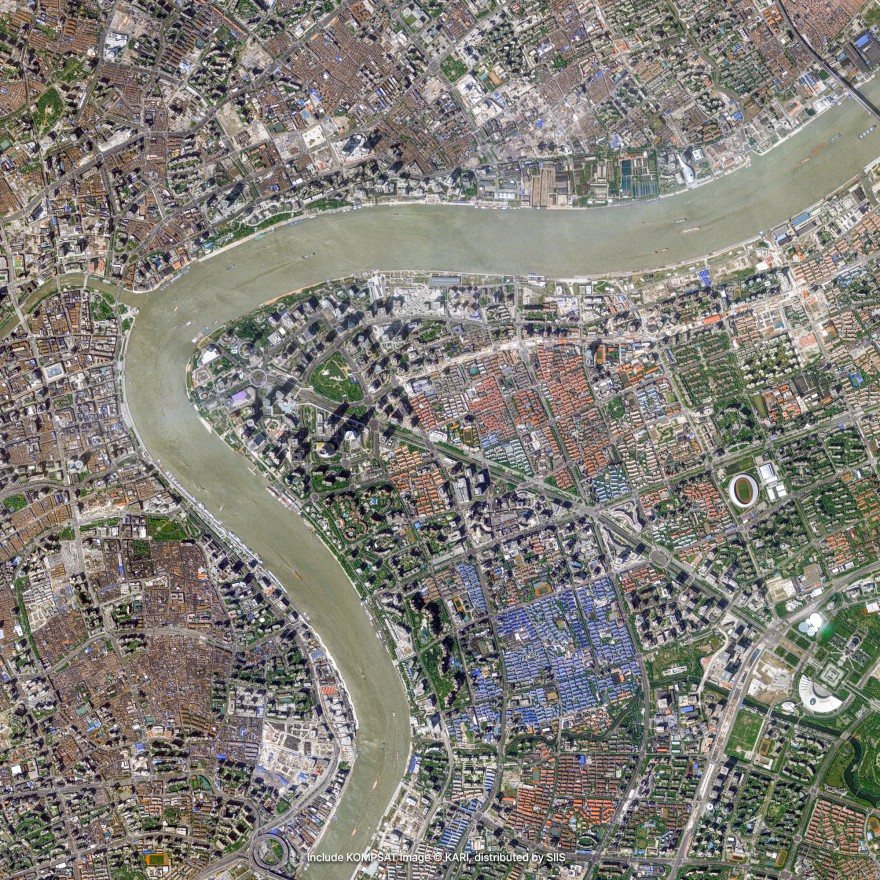
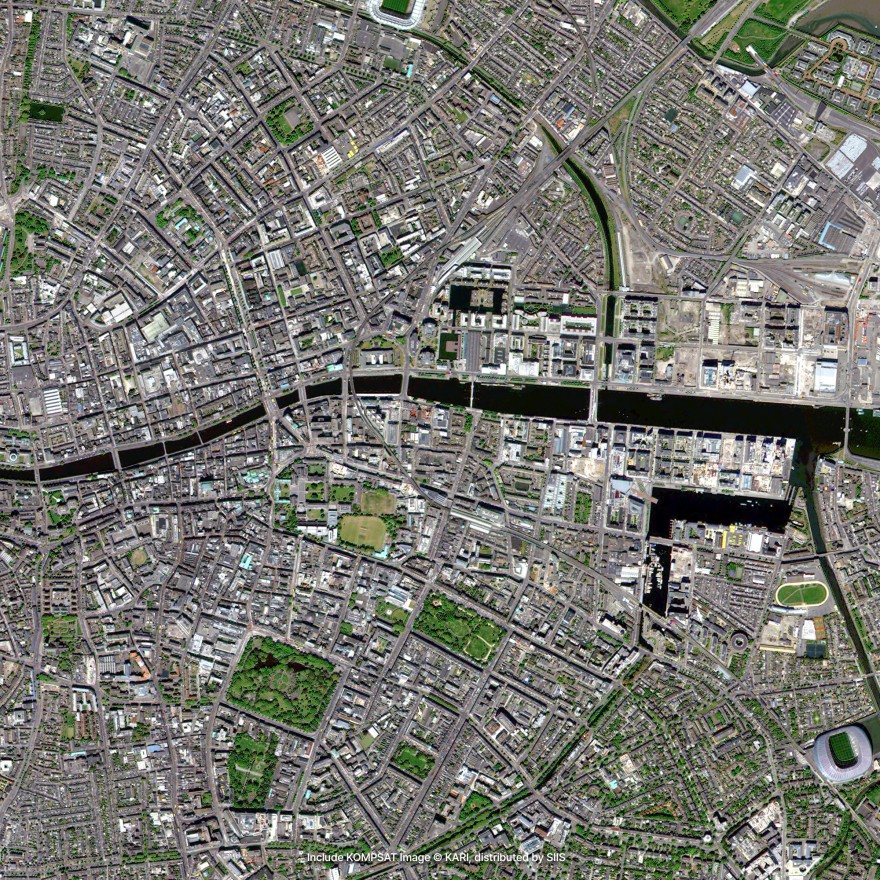
Very high-resolution imagery for precise mapping across East Africa, the wider continent and beyond. Spectral reflectance and spatial detail let you map land cover, tell residential buildings from commercial ones, and follow road networks and land use as they change.
  • Land cover and land use mapping
  • Urban growth and change detection
  • Elevation and 3D models, from stereo pairs
Satellite imagery of a large city on both banks of a wide river that bends through it, with dense blocks of buildings and a few parks
Satellite imagery of a dense city of streets and courtyards, crossed by a straight canal lined with docks, with a stadium at the lower right
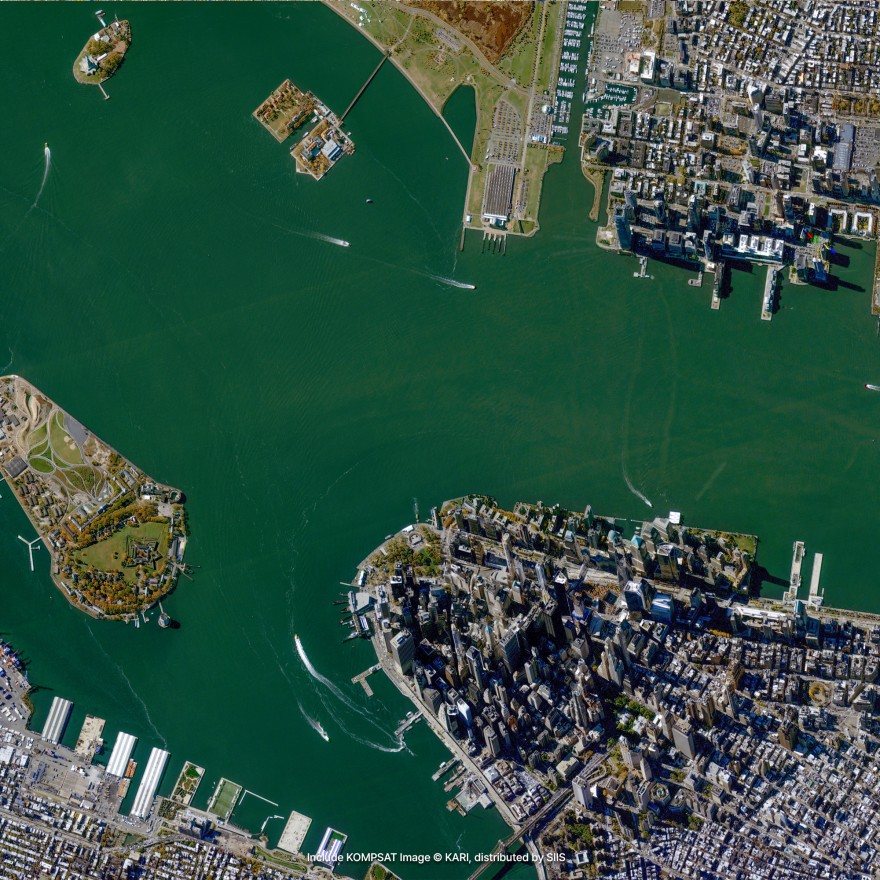
Satellite imagery of a harbour: the tip of a city of high-rise buildings, piers along its edge, and a green island in the water beside it

02

Infrastructure and energy.

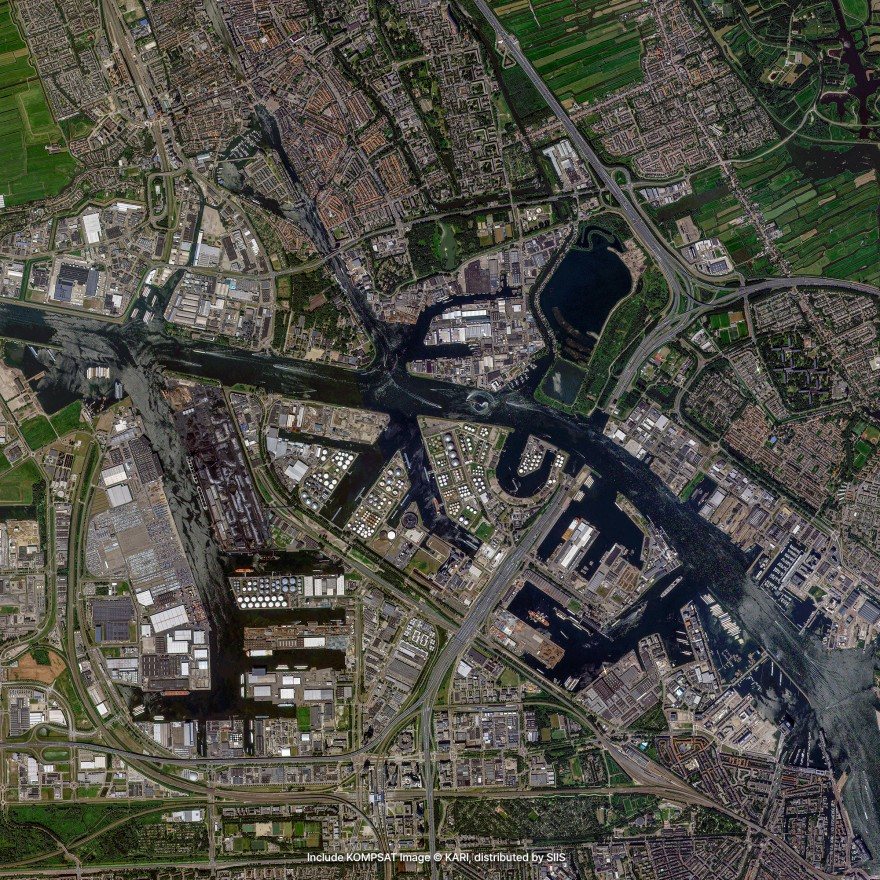
Imagery taken from the same angle at regular intervals lets you measure structures, verify construction phases and check whether a project is on schedule. The same approach follows oil and gas facilities, from siting and construction to expansion, and picks up pollution such as discharge into nearby rivers.
  • Construction progress on roads, bridges, ports and airports
  • Facility siting, expansion and condition
  • Environmental compliance around industrial sites
Satellite imagery of a port city: docks and basins cut into the waterfront, warehouses and industrial yards, and a motorway interchange
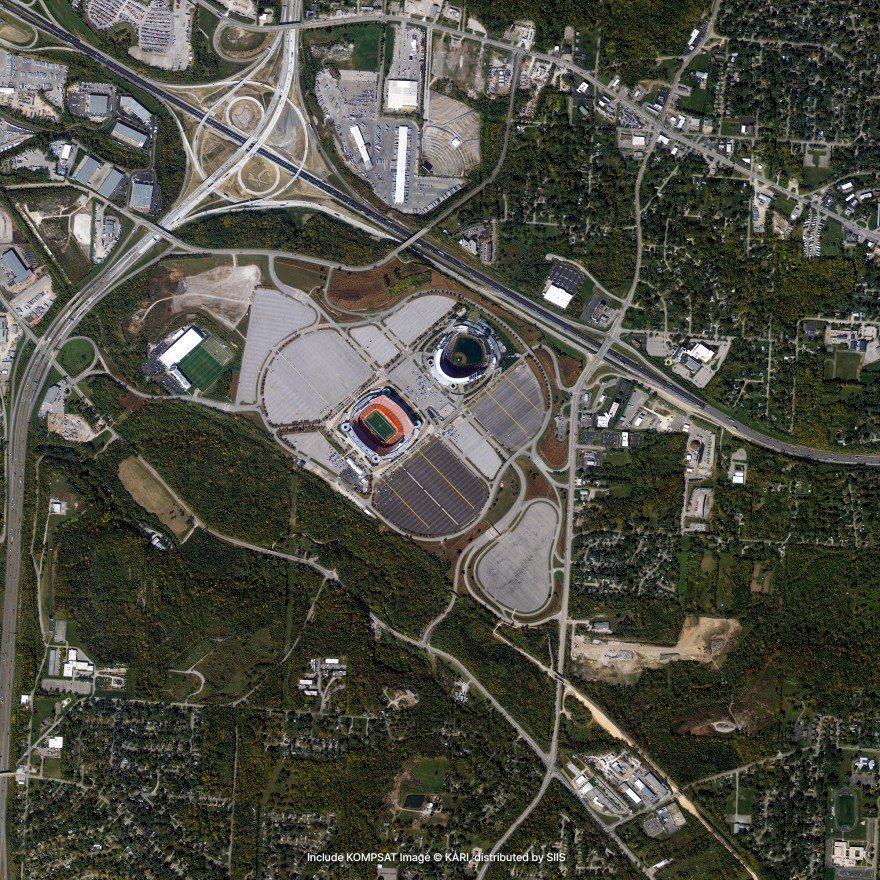
Satellite imagery of two stadiums in a sea of car parks, beside a motorway interchange and surrounded by woodland
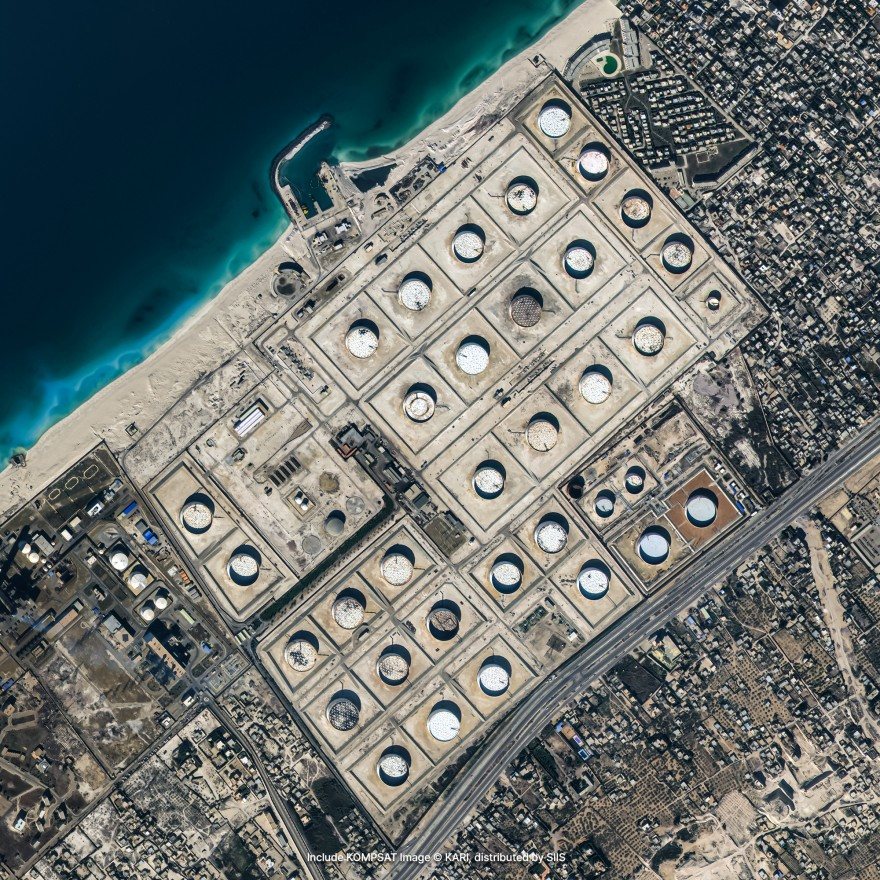
Satellite imagery of an oil storage depot on a coast: rows of round storage tanks inside walled bunds, between the sea and a town

03

Agriculture.

Precisely calibrated optical sensors support farming across large areas: detecting drought stress, identifying crop types and cultivated area, and timing planting and harvest. Healthy vegetation reflects more near-infrared light, so the NIR band shows crop vigour, and indices such as NDVI measure it.
  • Crop type and cultivated area
  • Crop health, and early signs of stress
  • Water, fertiliser and pesticide applied only where needed
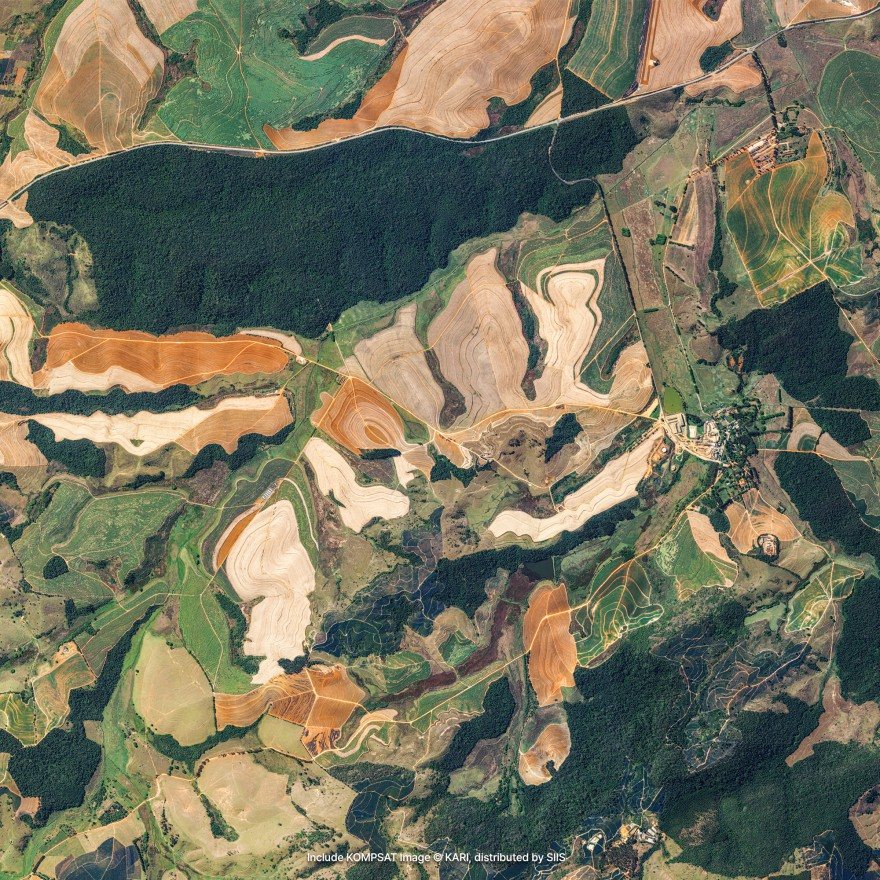
Satellite imagery of hilly farmland: ploughed and cropped fields in brown, cream and green, curving around a long dark patch of forest
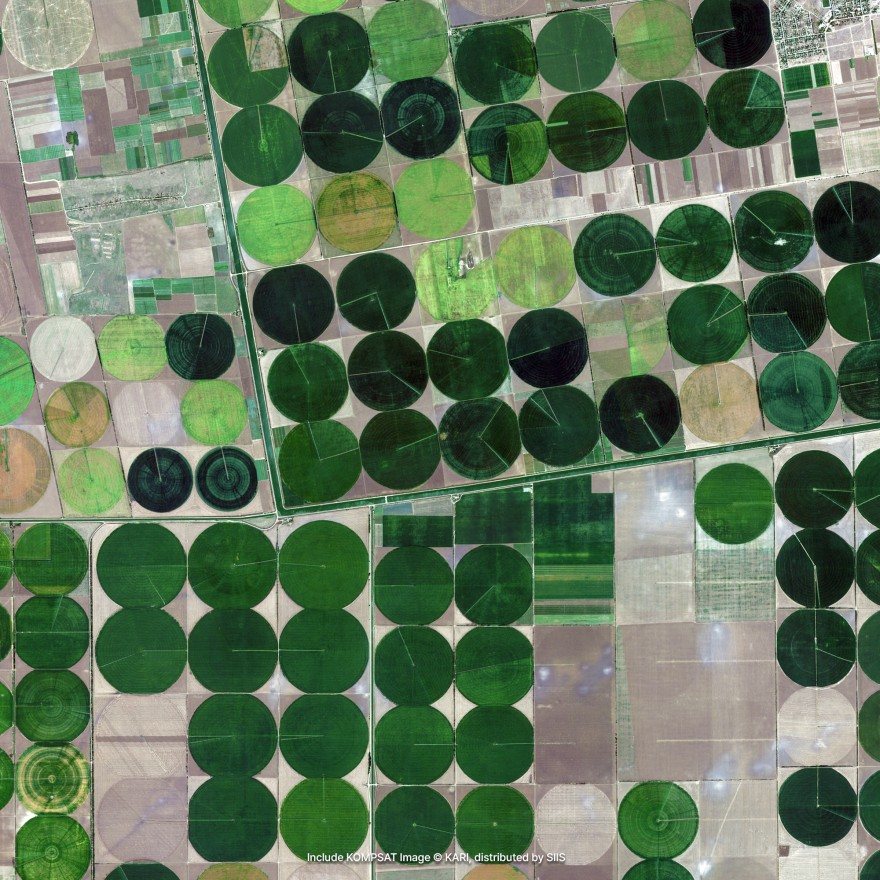
Satellite imagery of irrigated farmland: dozens of circular centre-pivot fields in shades of green, laid out in a grid
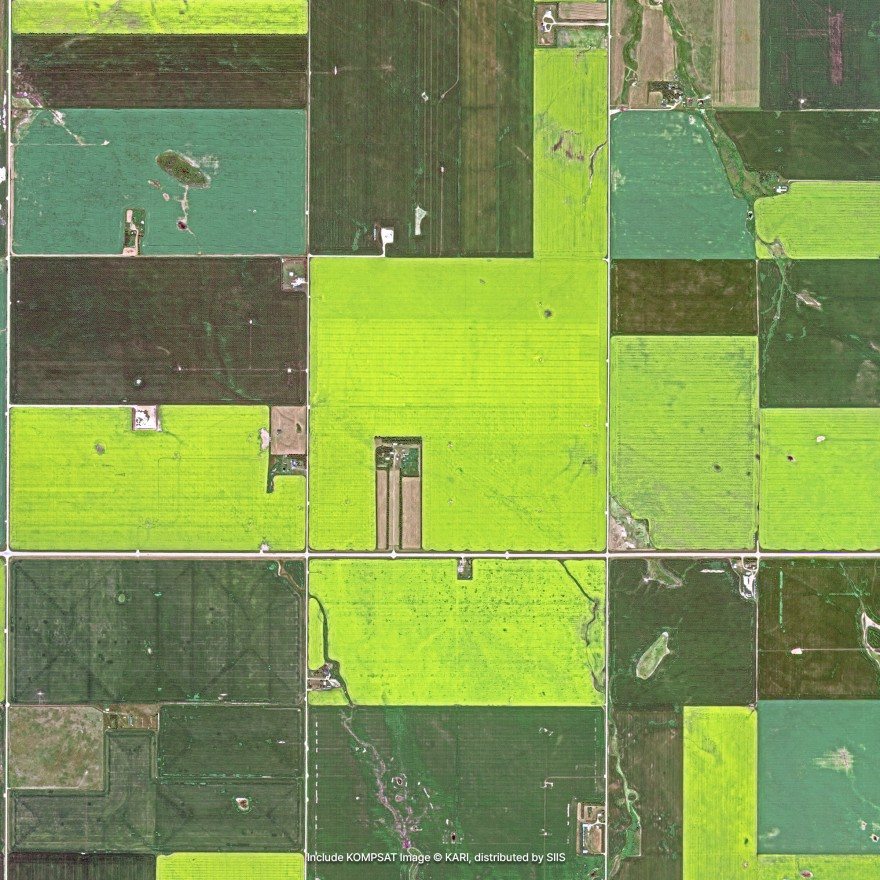
Satellite imagery of large rectangular crop fields, some bright yellow-green and some dark green or brown, divided by straight tracks

04

Environment and disasters.

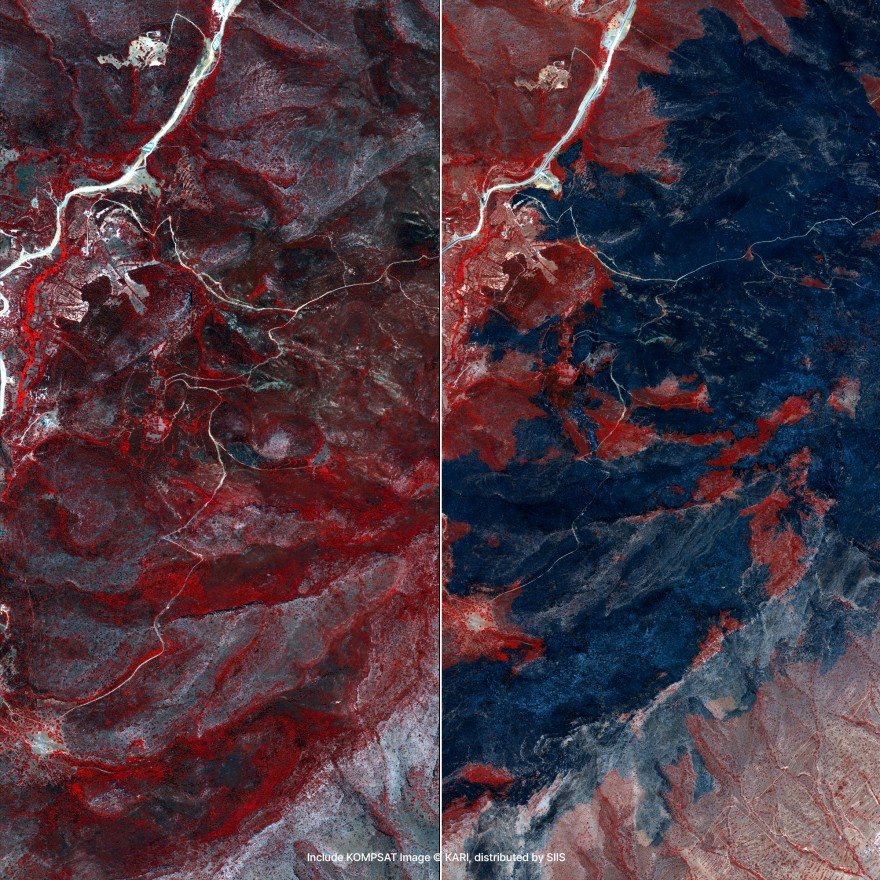
Near-infrared shows the health of vegetation over large areas, so forest and park managers can track deforestation, monitor protected areas and reforestation, and compare cover over time. KOMPSAT also supplies imagery to the International Charter on Space and Major Disasters, to map damage and plan recovery.
  • Forest cover, deforestation and land degradation
  • Protected areas and reforestation
  • Damage mapping after floods, fires and landslides
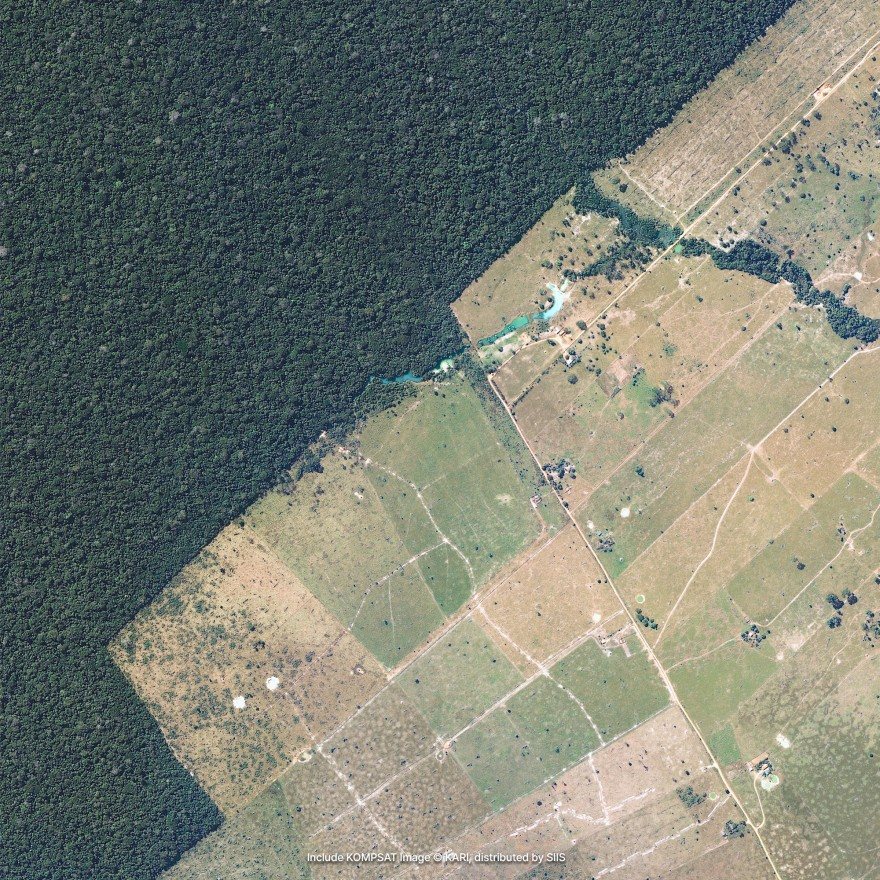
Satellite imagery of dense forest meeting cleared land, where the ground has been cut into rectangular plots with scattered trees
False-colour satellite imagery of the same hills twice, side by side: vegetation shows red, and on the right large areas have turned dark blue where it has burned
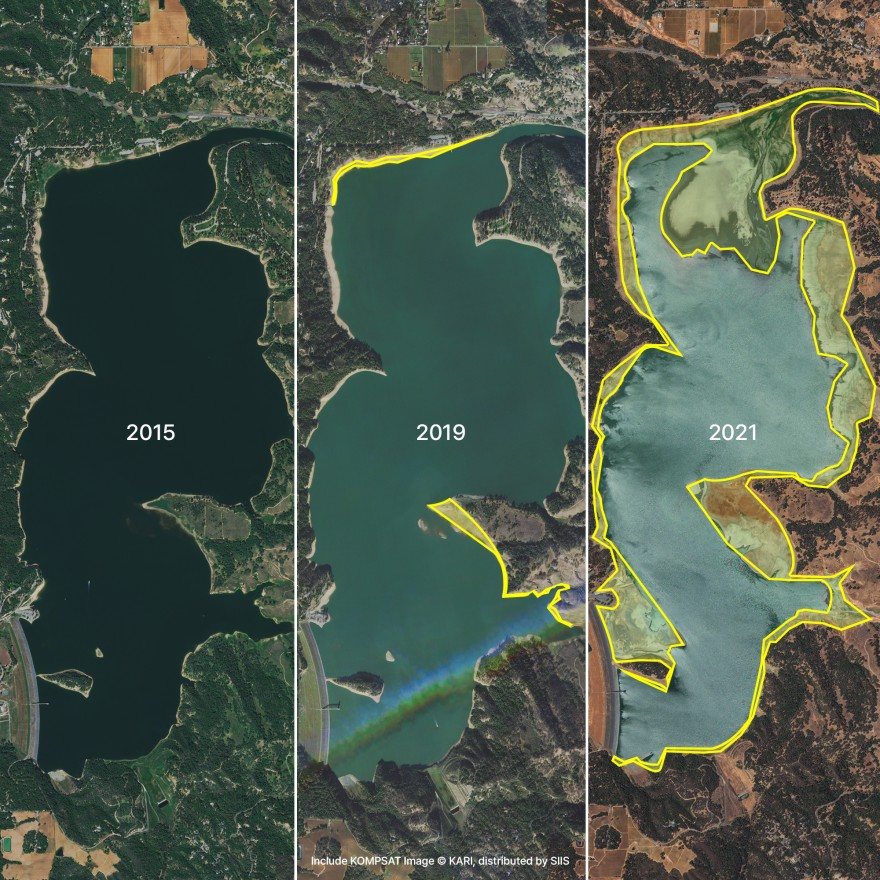
Three satellite images of the same reservoir labelled 2015, 2019 and 2021, with yellow outlines tracing the shoreline as the water shrinks

05

Maritime.

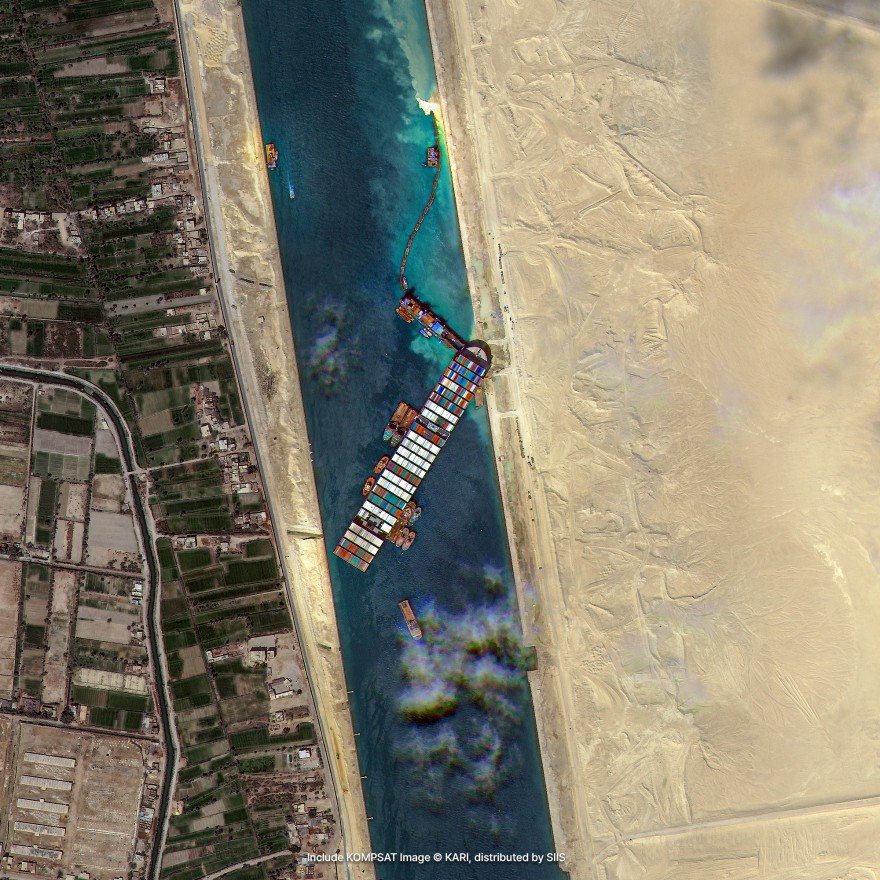
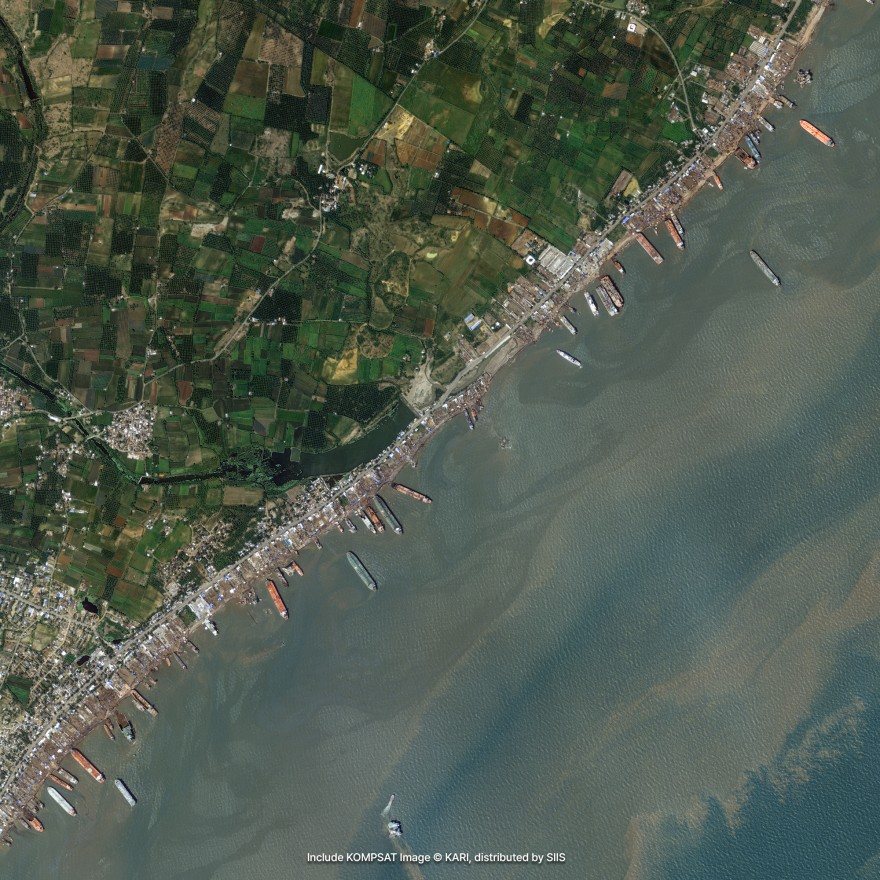
Vessels show up in optical imagery by their shape and shadow, even with their AIS switched off, which helps with illegal fishing and the Exclusive Economic Zones of the East African coast. KOMPSAT-5's radar sees day and night and through cloud, for ships, oil spills and illegal discharge.
  • Vessel detection, including ships without AIS
  • Oil spills, collisions and illegal discharge
  • Algal blooms and changes in water quality
Satellite imagery of a large container ship lying across a narrow canal, with tugs beside it, between irrigated farmland and desert
Satellite imagery of a coastline with small fields inland and dozens of boats moored or moving along the shore
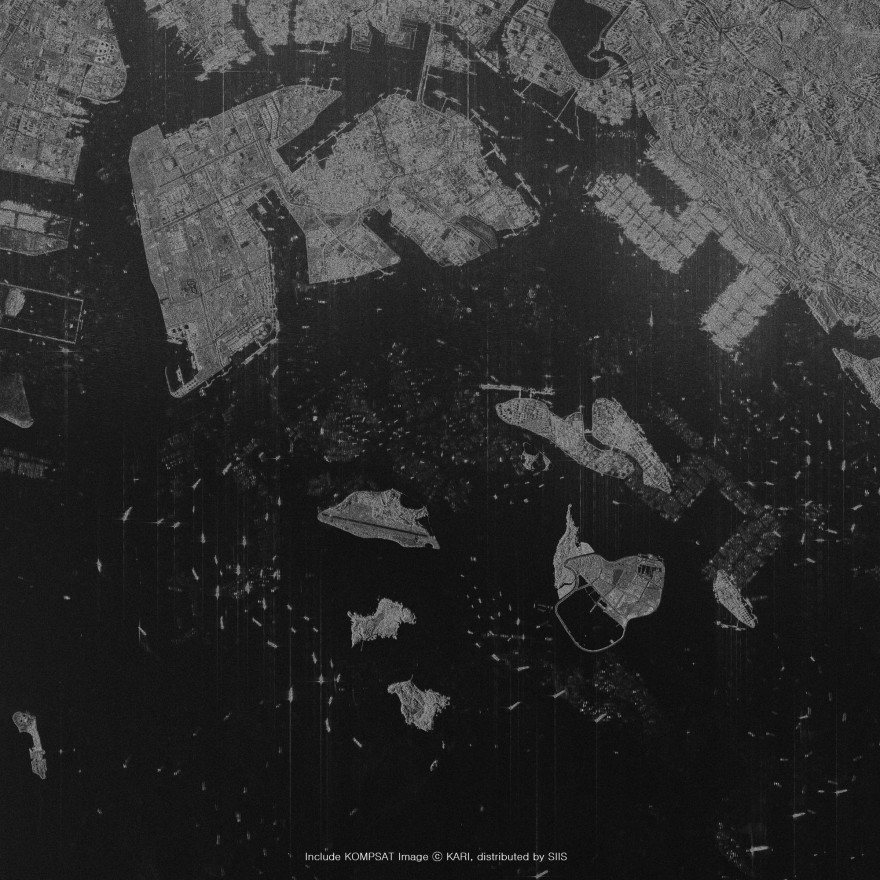
Radar satellite imagery in greys: a harbour city and islands, with ships at sea showing as scattered bright points on the dark water

06

Security and defence.

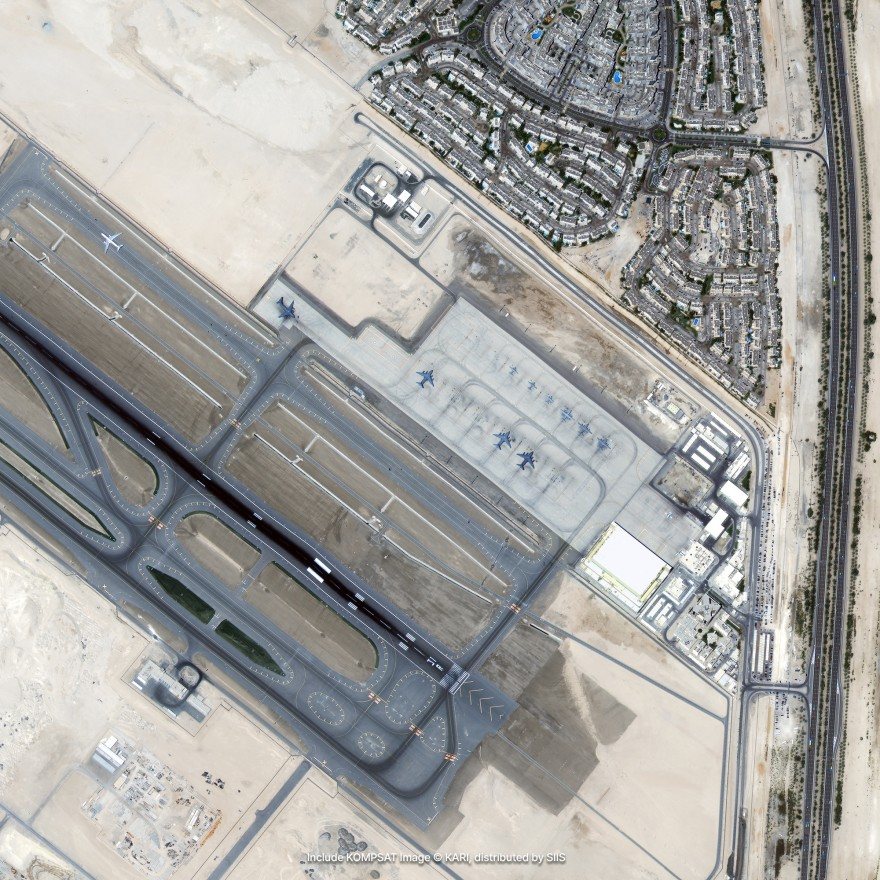
Optical and radar imagery gives government and security clients a regular view of the ground: sensitive sites and infrastructure, damage after an incident, and the terrain and layout of facilities for planning.
  • Site and infrastructure monitoring
  • Damage assessment
  • Terrain and facility mapping
Satellite imagery of an airport runway and taxiways in desert, with aircraft on the apron and a town beside it
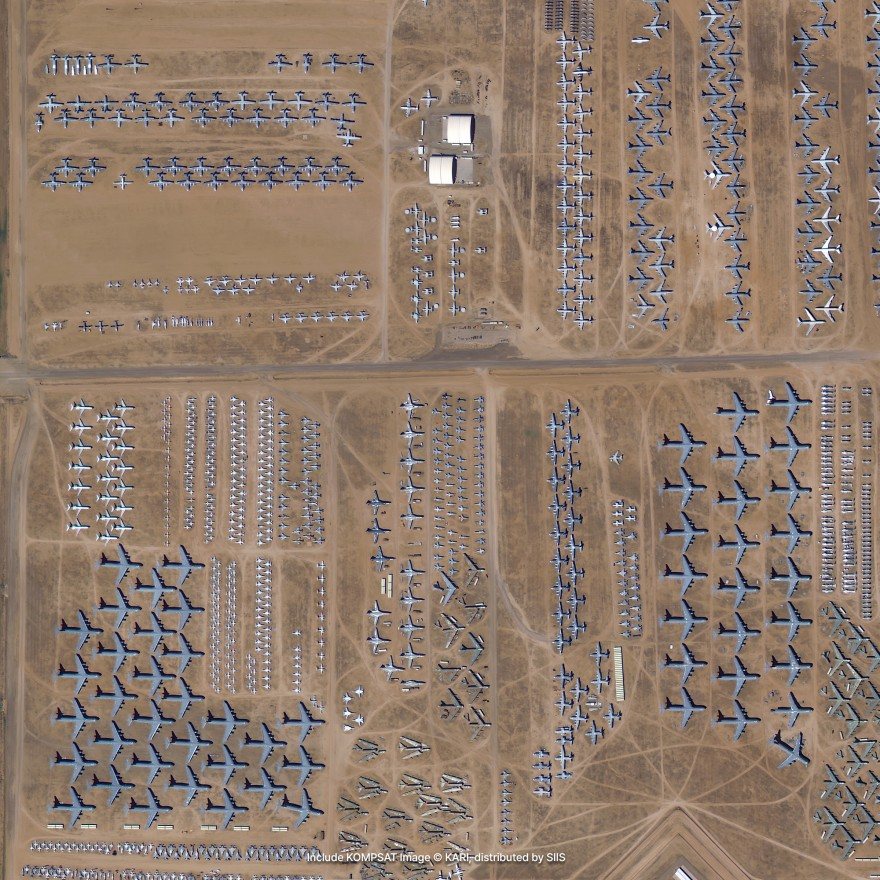
Satellite imagery of hundreds of parked aircraft in long rows on bare desert ground
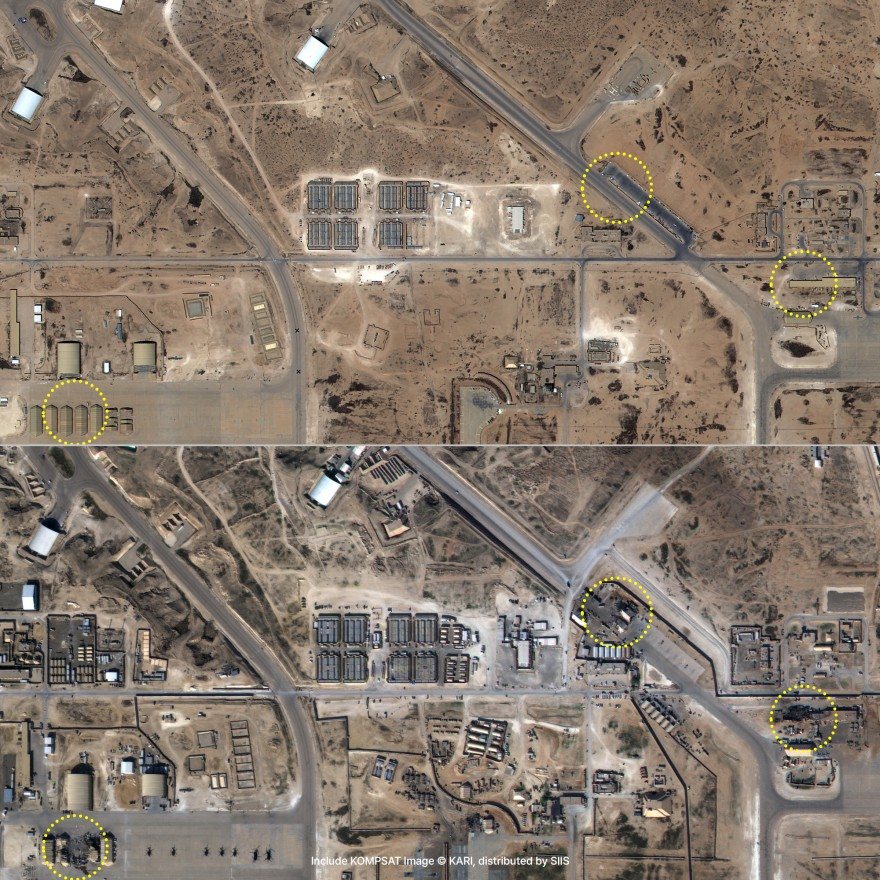
Two satellite images of the same airbase, one above the other, with yellow circles marking buildings that have been damaged in the later image

Sample imagery: KOMPSAT © KARI, distributed by SIIS.

03 · Ordering

How ordering works.

  • Tell us the area

    Send the area, the dates you need and how fine the detail has to be.

  • Archive or new capture

    We check the archive for imagery that already exists and, where there is none, arrange a new capture. You have a quote before anything is ordered.

  • Delivered as supplied

    The imagery arrives as SIIS delivers it, at the processing level you ordered. If a project needs it taken further, our remote sensing team can do that too.

Need analysis as well as imagery? See Remote Sensing

04 · Reading the specs

Modes and terms.

Imaging modes

  • Strip

    One continuous corridor, along a road, river, pipeline or coastline.

  • Multi-point

    Several separate sites imaged in a single pass, for monitoring work that is scattered.

  • Stereo

    The same ground from more than one angle, for elevation models and 3D models of towns.

  • Wide area

    Adjacent strips stitched together, for regional planning, land cover mapping and disaster monitoring.

Terms

PAN
Panchromatic. One broad band, 450–900 nm, recorded in black and white at the satellite's finest detail.
MS
Multispectral. Narrower bands (blue, green, red and near-infrared) at coarser detail, used for colour and vegetation analysis.
GSD
Ground sampling distance: the size of one pixel on the ground. At 40 cm, each pixel covers 40 × 40 cm.
Swath width
The width of ground imaged in one pass.
nm
Nanometre, a billionth of a metre: the unit the wavelengths of light are measured in.
Bit depth
How many brightness levels each pixel can record: 1,024 at 10 bits, 16,384 at 14.
RMSE
Root mean square error: the average location error across the image.
CE90
Circular error at 90%: nine in ten points fall within this distance of their true position.
POD / PAD
Precise orbit and attitude determination: measuring where the satellite was and where it pointed, to improve location accuracy.
Level 1R
Radiometrically corrected: sensor noise removed, with no geometric correction.
Level 1G
Geometrically corrected: basic geometric corrections applied, without ground control points.
Ortho-ready
Prepared for orthorectification. Terrain correction is still to be done.
SAR
Synthetic aperture radar. It images with radar rather than light, so it works at night and through cloud.
Radar levels
Level 1A (SLC) keeps the radar's phase, for InSAR. Level 1C is radiometrically corrected, without phase. Level 1D is georeferenced and ready for GIS.
InSAR
Combining radar images of the same place, taken at different times, to measure how the ground has moved.
UTM / WGS84
The map projection, and the global reference system GPS uses, that the imagery is delivered in.
GeoTIFF / HDF5
File formats. GeoTIFF carries its geographic reference, ready for GIS. HDF5 is used for radar data.

Ready when you are

Tell us the area. We will find the imagery.

Send the area, the dates and the detail you need. We check the archive, arrange a new capture where there is none, and quote.
020 765 0202 · +254 794 338133 · info@geosurveysandgeospatialinfo.co.ke

Satellite imagery

Order imagery.

Tell us the area and what you need. We check the archive or plan a new capture, and come back with a quote. Nothing is charged here.

  1. 1Area
  2. 2Imagery
  3. 3Contact

Where is the area?

Any one of these is enough: a place, coordinates, a description or a boundary file.

Drop files here or click to choose

KML, KMZ, GeoJSON, a zipped shapefile, GPX, PDF or an image. Up to 3 files, 2.5 MB in total. Anything larger, email to us after sending.

Step 1 of 3